Stocks beat home prices in every US state over 40 years, after tax, a WSJ study finds (opens the source in a new tab)
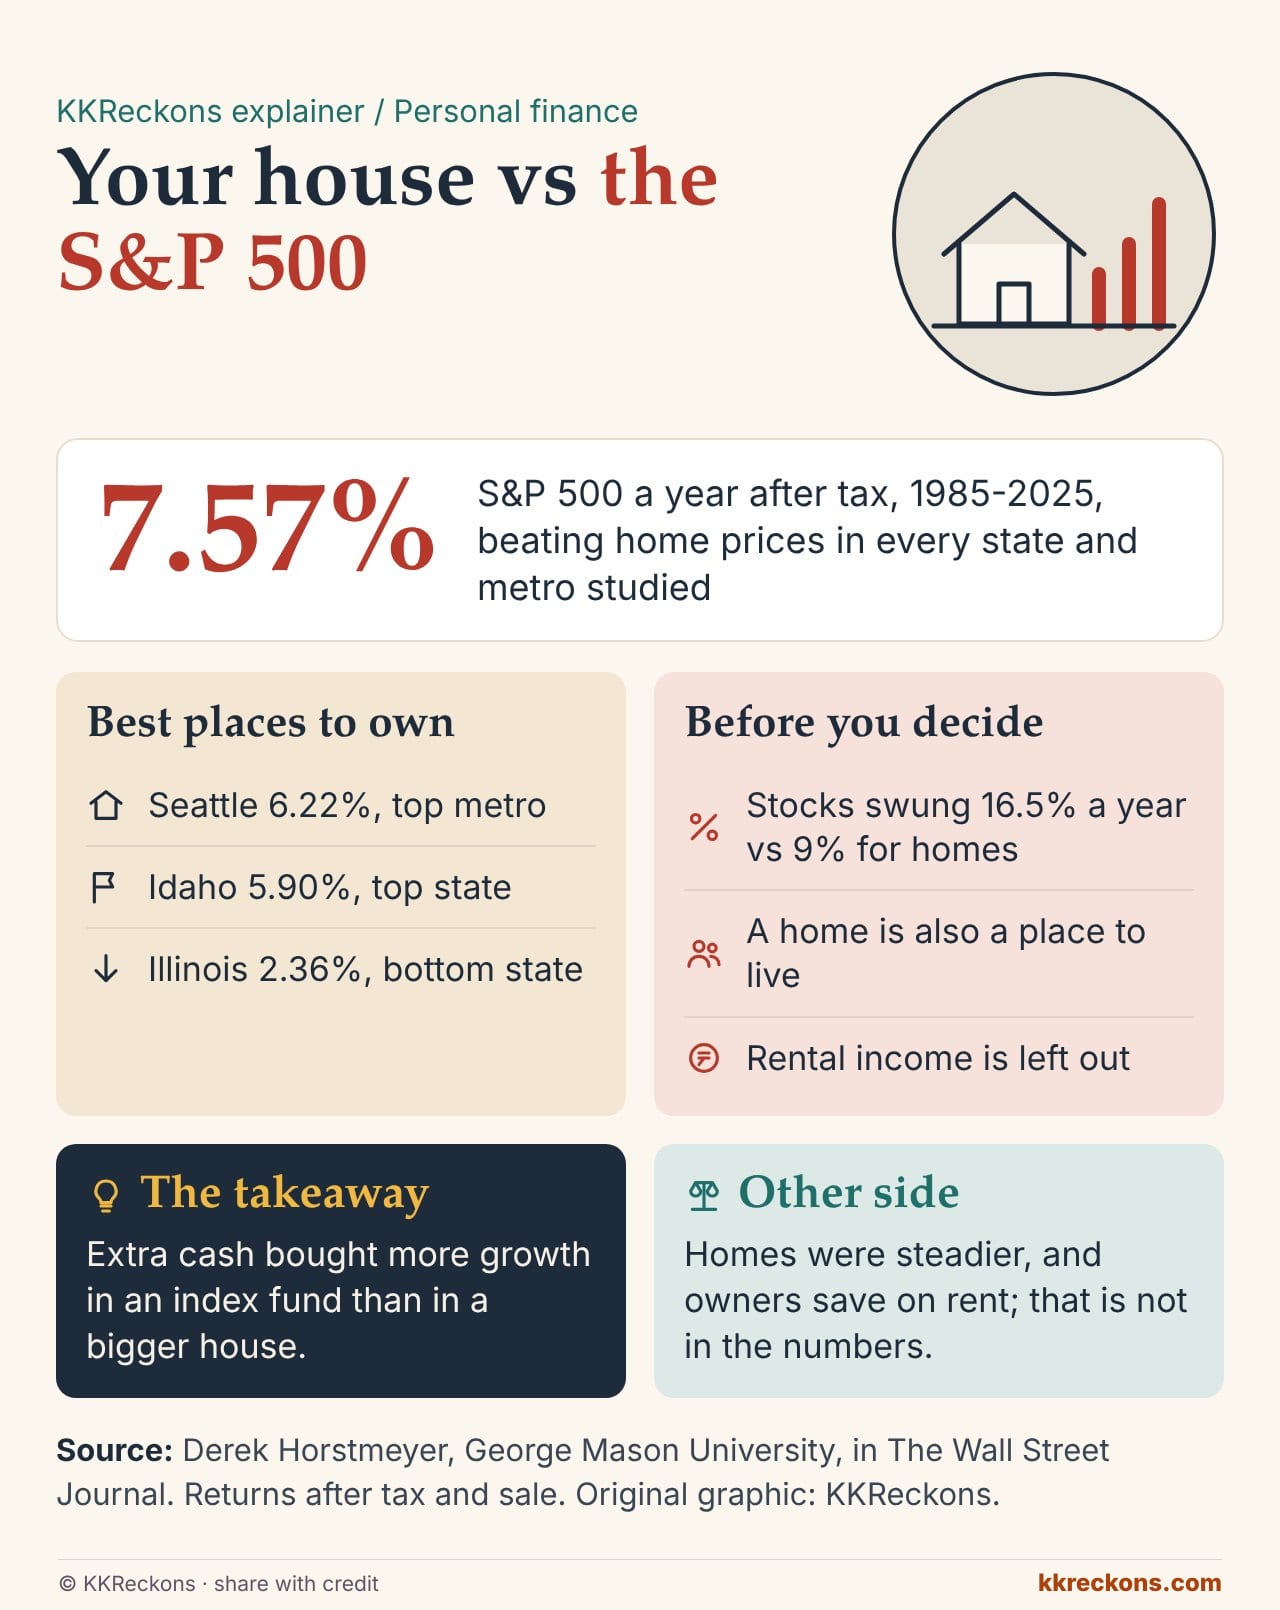
- George Mason's Derek Horstmeyer modelled a 1985 buyer of a $100,000 home deciding whether to spend extra cash on a bigger house or the S&P 500, with 20% down, a floating-rate mortgage, and taxes and sale costs counted to end-2025.
- Stocks won everywhere: 7.57% a year after tax, against 6.22% for the best metro, Seattle, and 5.90% for the best state, Idaho. Illinois came last at 2.36%.
- Homes were far steadier, swinging about 9% a year against 16.5% for stocks, and the study leaves out buying to rent.
- 7.57%
- S&P 500 a year, after tax, 1985-2025
- 6.22%
- best metro (Seattle)
Why it matters It reframes a common choice: money that stretches a mortgage for a bigger house has usually compounded faster in a plain index fund. The same logic applies to Indian families weighing a second flat against equity funds, though local prices, taxes and rents differ.
Other side A home gives shelter, stability and forced saving, and the bigger house saves rent the model does not count. Stocks' far wider swings also test nerves; many investors sell at the bottom, which a house rarely tempts them to do.